University of Chicago // Center for Digital Scholarship Data Visualization Fellowship // Jasmine Lu, Ph.D. // May 2026
Project Overview
Electronic waste or e-waste is the fastest growing consumer waste stream in the world. Oftentimes, e-waste is generated when electronic devices break and the average consumer determines that it’s easier to throw away a device and replace it anew rather than to find a way to repair it. In fact, many devices are intentionally designed to make repair difficult and relevant repair guides can be limited. It is extremely challenging, time-consuming, and at times even impossible to acquire repair guides for the exact make and model for a given device. Additionally, it can be even more challenging for novices to extrapolate which fixes from a similar device might be worth attempting. These barriers to repair are highly unsustainable as devices are increasingly built for planned obsolescence, assuming they will become e-waste in a few years’ time.
This project aims to reduce the barriers to repair for the average consumer by using data visualization techniques to synthesize data from repair data sources (e.g., iFixit guides) and organize the most relevant information in an interactive repair visualization.
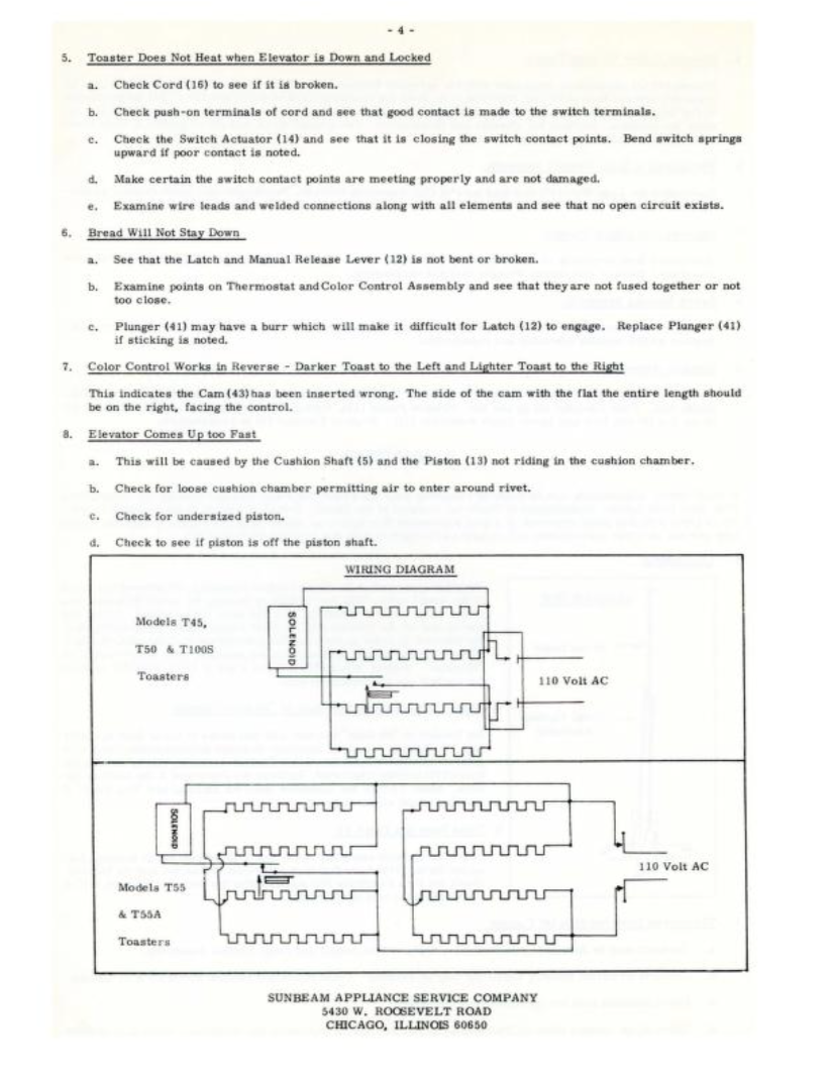
There is a lot of really interesting data associated with repairing devices. Older device manuals reflected this by proving much longer and more detailed sections around how to actually care for and repair your device. For example the image on the right shows trouble shooting steps and circuit diagrams for an old toaster as well as how to seek out replacement parts.
On the other hand, newer device manuals do not really treat users as true owners by providing device information for repair. Instead, most language is around warranties and how to send the device back to the company for servicing.
Meanwhile the internet has a plethora of diverse repair sources from videos, manuals, and guides (oftentimes user-generated content around repair). Collecting and organizing this data is the focus of this project. For this fellowship, I look specifically at iFixit data.
Using iFixIt's guide API, I pulled all the relevant guides and teardowns per device and scripted a data collection process that used a combination of natural language processing techniques and manual verification identify relevant device parts, actions, and tools of devices. This involved assuming that instruction steps would follow a somewhat consistent format of [ACTION VERB] on [DEVICE PART], which could be encoded as a pattern to match for with spaCy's dependency matching tools. I verified these matches and filtered for actual parts across devices, collecting these in a massive .csv file.
These network graph visualizations are all constructed using d3.js. Interactive elements are built using javascript, HTML, CSS and using Bootstrap elements.